|
|
|
|
Using of improved power system visualization in modern energy managment systems could reduce the risk
of major blackouts [1, 2]. One of the most efficient types of visualization is contouring, main idea
is presented [3].
Diferent types of contouring were developed in the Department of Energy, each of them based on
using of different technologies and PC hardware.
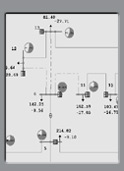
Power system visualization based on CPU mesh generation and GPU fixed-functional
rendering pipeline shown in figure:
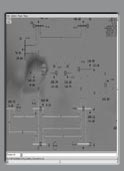
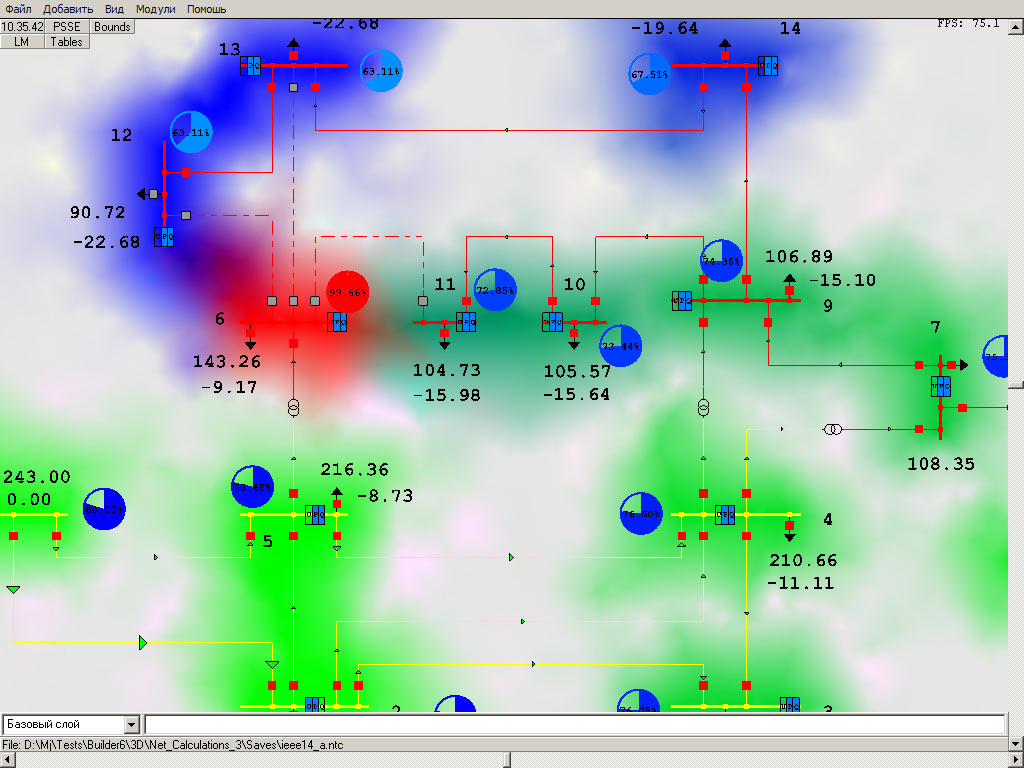
Dramatically improved during last decade GPU capabilities and performance potential together with programmable
rendering pipeline allow to emplement advanced visualization based on using pixel (fragment) shaders.
In comparison with CPU based this type of image generation achieves very high performance and
could be used for contouring of PMU data in real time.
Video examples (IEEE-14, random state each 50ms):
video eample 1
[3.4 Mb/1024x768/xvid]
video eample 2
[2.16 Mb/1024x768/xvid]
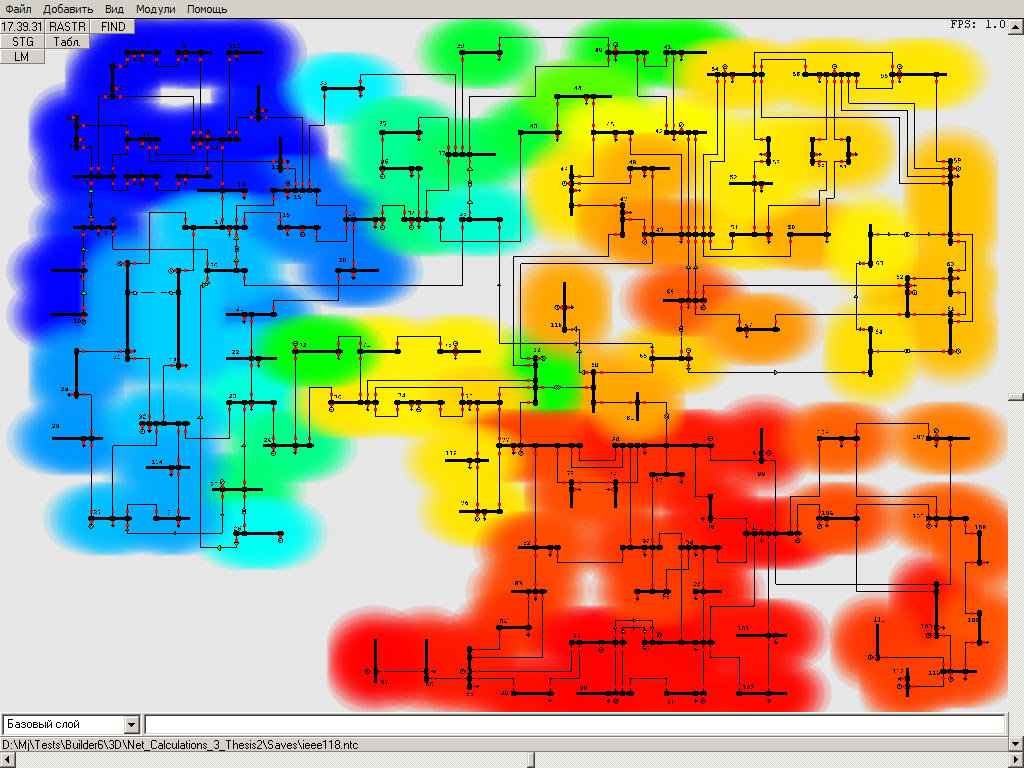
Appearance in rendering pipeline new type of shader (geometry) allows
to speed up process of contouring. Using of this type of image generation could lower
down CPU usage as much as possible and at the same time achive high speed of data visualization
with negligible reduction of the quality of processed images.
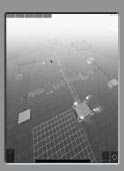
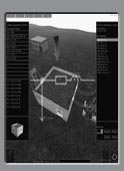
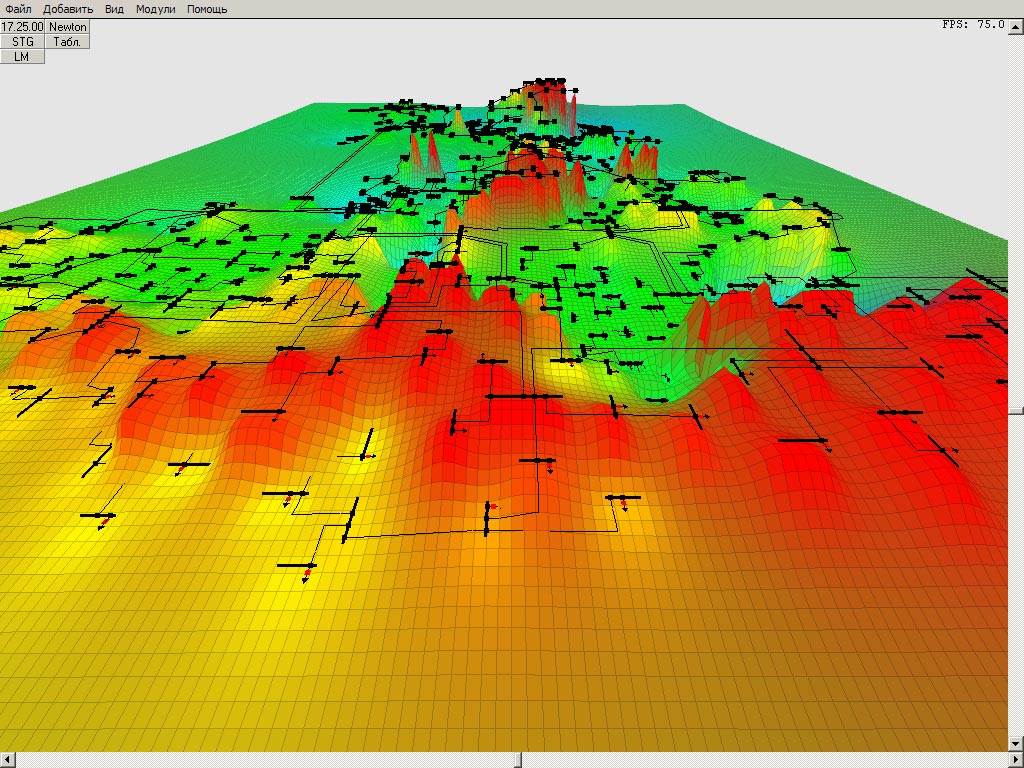
Different approaches of 3D visualization in power system monitoring
and analysis were explored in [4], however advantages and methods of using modern GPU`s for high-speed high-quality
3D visualization has not been discussed so far. We developed new GPU accelerated visualization method, sutable for
real time large scale power systems visualization.
Video examples:
video example 1
[33.5 Mb/1024x768/xvid] (Test case 629 buses)
video example 2
[34.1 Mb/1024x768/xvid] (Test case 629 buses, powerflow analysis each 1.5 seconds)
video example 3
[19.3 Mb/1024x768/xvid] (IEEE-14, powerflow analysis each 50 milliseconds)
1. Thomas J. Overbye, Douglas A. Wiegmann, "Reducing the risk of major blackouts through improved power system visualization", 15th Power System Computation Conference, August 2005, Liege, Belgium.
2. John P. Stovall, Brendan J. Kirby, Thomas J. Overbye, James S. Thorp, Arun G. Phadke, "Issues Associated with the Development of a Wide-Area Analysis and Visualization Environment", Hawai International Conference On System Sciences, January 4-8, 2006, Hawai.
3. D. Weber and T. J. Overbye, "Voltage contours for power system visualization," IEEE Trans. on Power Systems, vol. PWRS-15, pp. 404-409, February, 2000.
4. Three-dimensional visualization and animation for power systems analysis / F. Milano // Electric Power Systems Research 79 (2009).
|
|
|
|
|
|